Data & Reporting
Farm Analytics
Valvix turns raw sensor data into actionable insights — correlating environment, inputs, and yield so you can make better decisions every growing cycle.

- Metrics tracked per zone
- 50+
- Full data history per sensor
- 2 yr
- Report generation for any period
- 1-click
The Problem
Most farms collect some data but can't use it. Readings sit in spreadsheets or sensor logs without any connection to what actually happened to the crop. Understanding what drove a good harvest — or a bad one — requires correlating dozens of variables over time.
Reports require manual data collection from multiple sources
Can't compare this season to last season in a meaningful way
Decisions are based on experience and gut feeling, not evidence
How Valvix Solves It
All farm data flows into one place
Sensor readings, irrigation events, climate actions, energy use, and manual entries all feed into the Valvix analytics engine.
Correlations are calculated automatically
Valvix finds statistically significant relationships between inputs and outcomes — for example, which humidity range correlates with your best yields.
Interactive charts let you explore any metric
Filter by zone, time period, crop type, or event type. Drill down from annual trends to individual days.
Comparison reports show season-over-season change
Compare the same period across multiple years to understand long-term trends and the effect of operational changes.
Real Installations


What You Get
Yield correlation analysis
Understand which environmental conditions produced your best harvests
Season comparison
Compare any metric across multiple growing cycles side by side
Custom report builder
Filter by zone, date, crop type, or event — export in one click
Data-backed recommendations
Valvix suggests specific changes based on patterns in your own history
Years of full history
Complete sensor logs stored at full resolution for deep analysis
Team sharing
Share reports with agronomists, investors, or certification bodies directly from the dashboard
Common Questions
How far back does the analytics data go?
Full-resolution sensor data is stored for 2 years. Hourly aggregates are stored indefinitely. If you have historical data from before Valvix, our team can help import it.
Can I export data for use in other tools?
Yes. Any report or dataset can be exported as CSV or XLSX. We also offer an API for integration with ERP or accounting systems.
How do I track yield in Valvix?
You enter harvest data manually (weight, grade, zone) via the app or web dashboard. Valvix then correlates this with all environmental data from that growing period.
Can I share access with my agronomist?
Yes. You can create a read-only account for consultants, agronomists, or certifiers with access to specific data.
Are the recommendations based on general benchmarks or my own data?
Primarily your own data. Valvix uses your farm's history to generate suggestions. General agronomic benchmarks are used to fill gaps in early deployments.
Ready to automate your operation?
Free consultation · No obligation
Request a Demo →Explore More Applications
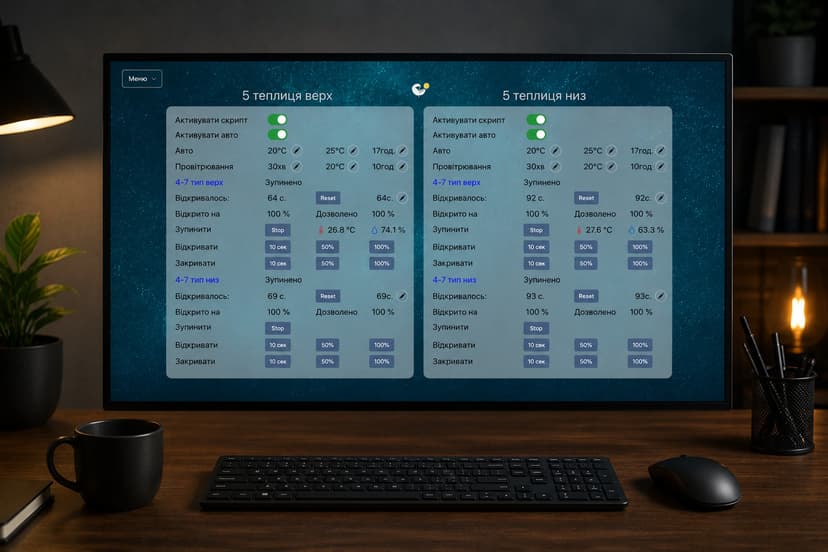
Climate Control
Climate Automation
Valvix maintains ideal growing conditions automatically — controlling ventilation, heating, cooling, and humidity based on live sensor data, not manual settings.
Read more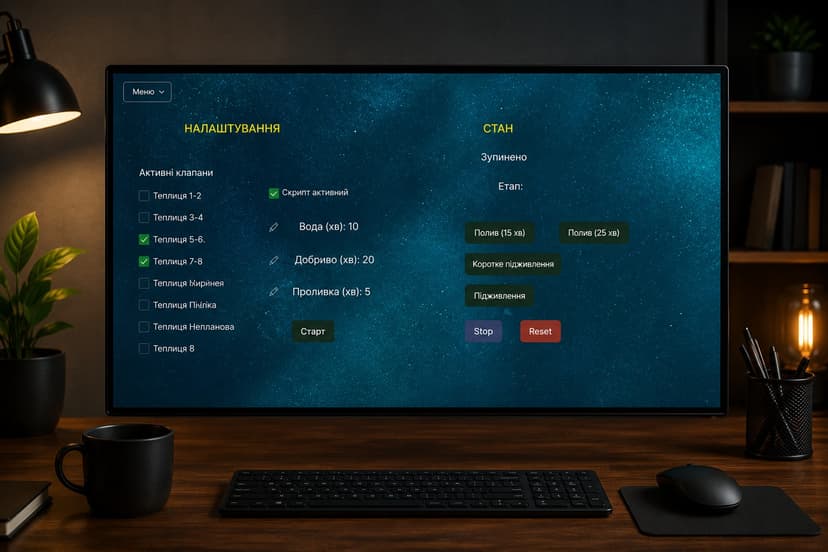
Water Management
Smart Irrigation
Valvix delivers the right amount of water and nutrients to each zone — based on actual soil conditions, not a fixed schedule. Save up to 40% water while getting better yields.
Read more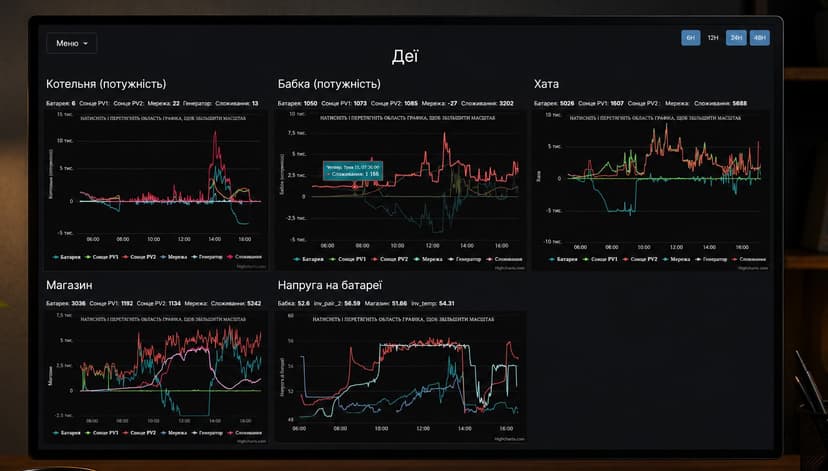
Energy Management
Energy Efficiency
Valvix reduces energy consumption across your entire operation — heating, lighting, irrigation pumps, and ventilation — by running equipment only when actually needed.
Read more