Monitoring
Real-Time Monitoring
Every sensor across every zone — live on one dashboard. Temperature, humidity, CO₂, EC levels, and more, updated every few seconds so you always know what's happening in your farm.

- Update interval for all sensors
- 1 sec
- Sensor types supported
- 100+
- Continuous data without gaps
- 24/7
The Problem
Without real-time visibility, problems grow silently. A temperature spike, a humidity drop, or a CO₂ imbalance can damage an entire batch before anyone notices. Manual spot checks happen too rarely and miss the moments that matter most.
No single view across multiple zones or greenhouses
Alert emails arrive too late to prevent crop damage
Historical data scattered across notebooks and spreadsheets
How Valvix Solves It
All sensors connect to the Valvix hub
Wireless and wired sensors across your farm feed data into the central Valvix controller every second.
Data streams to your dashboard in real time
The Valvix cloud processes and visualizes every reading — no delay, no data loss, even during connectivity gaps.
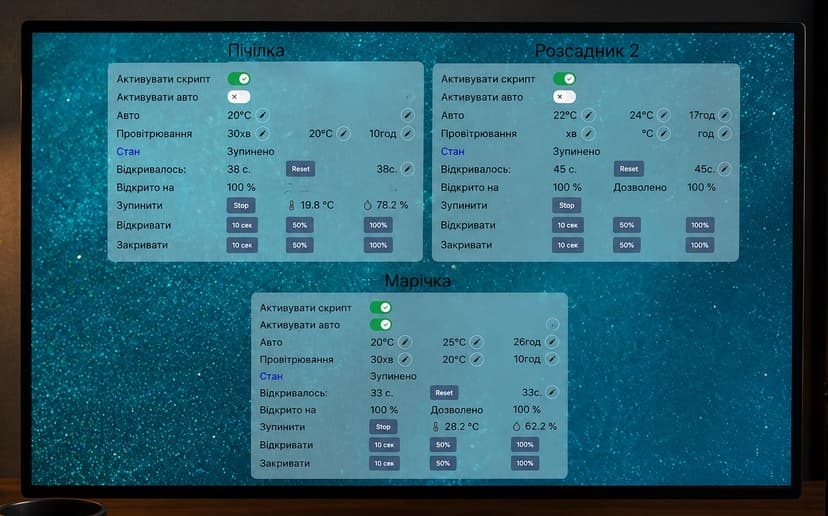
Thresholds trigger instant alerts
You define acceptable ranges per zone. When any reading crosses a threshold, a push notification reaches your phone immediately.
Trend charts reveal hidden patterns
Review hourly, daily, and seasonal trends per zone — spot correlations between environment and crop performance.
Export reports for any period
Download sensor logs as CSV or PDF for compliance, insurance, or planning purposes.
Real Installations


What You Get
Live data every second
All sensors update continuously — no manual polling or scheduled syncs
Instant threshold alerts
Custom alert rules per zone send push notifications the moment something goes wrong
Historical trend charts
Review data for any time period — hour, day, week, season
Offline resilience
Data is buffered locally during outages and synced automatically when connectivity returns
Multi-zone overview
See all zones on one screen with color-coded status indicators
Export-ready reports
Download logs as CSV or PDF for any date range with one click
Common Questions
What sensors does Valvix support?
Valvix works with a wide range of sensors including soil moisture, temperature (air and soil), relative humidity, CO₂, EC, pH, light intensity, and pressure. A full compatibility list is available from our team.
How often does the dashboard update?
Sensor readings update every 1–5 seconds depending on sensor type and network conditions. The dashboard refreshes automatically without needing to reload.
Can I set different alert thresholds per zone?
Yes. Each zone has independent threshold settings for every parameter. You can also define escalation rules — for example, a second alert if the problem persists for more than 10 minutes.
How much historical data is stored?
Valvix stores full-resolution sensor history for 2 years. Aggregated data (hourly averages) is stored indefinitely.
Does monitoring work without internet?
Yes. The Valvix controller stores data locally during outages. When connectivity is restored, all data syncs to the cloud automatically.
Ready to automate your operation?
Free consultation · No obligation
Request a Demo →Explore More Applications
Remote Control
Remote Management
Control every aspect of your farm from your phone — valves, climate systems, alerts, and schedules — from anywhere in the world, at any time.
Read more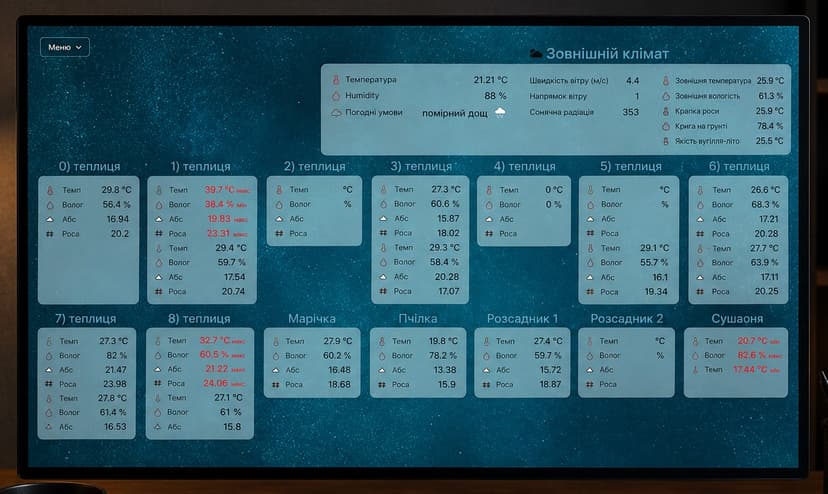
AI Analytics
Yield Optimization
Valvix AI analyzes your complete farm history and suggests specific, data-backed changes to growing conditions — so every cycle performs better than the last.
Read more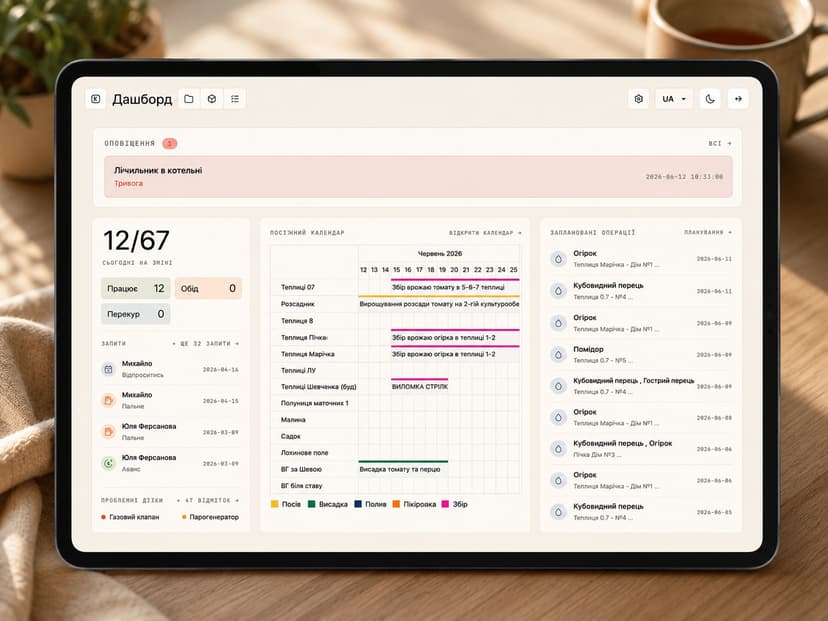
AI Analytics
Predictive Alerts
Valvix AI analyzes patterns across all your sensors and flags developing problems hours before they become visible — giving you time to act, not just react.
Read more